Advanced topic: Fitting (optional)
Overview
Teaching: 0 min
Exercises: 0 minQuestions
How can I fit a common function to a histogram?
Objectives
Fit a distribution to the Z peak.
I want to zoom in on the Z resonance:
plt.hist(dimuon_p4.mass, bins=40, range=(70, 110))
plt.xlabel('Dimuon invariant mass [GeV]')
plt.ylabel('Number of dimuon events / 1 MeV')
plt.show()
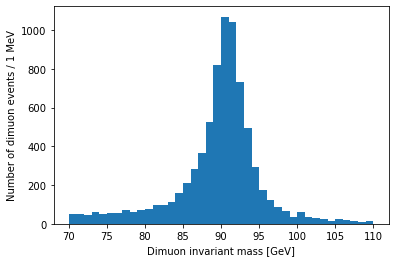
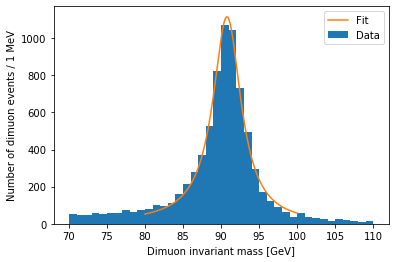
Resonances are described by the relativistic Breit-Wigner distribution. We should be able to fit one to this peak:
from scipy.optimize import curve_fit

def relativistic_breit_wigner(x, resonance_mass, width, normalization):
    gamma = np.sqrt(resonance_mass ** 2 * (resonance_mass ** 2 + width ** 2))
    k = 2.0 * np.sqrt(2) * resonance_mass * width * gamma / (np.pi * np.sqrt(resonance_mass ** 2 + gamma))
    return normalization * k / ((x ** 2 - resonance_mass ** 2) ** 2 + resonance_mass ** 2 * width ** 2)

bin_contents, bin_edges = np.histogram(dimuon_p4.mass.to_numpy(), bins=20, range=(80, 100))
bin_centers = (bin_edges[:-1] + bin_edges[1:]) / 2.0
popt, pcov = curve_fit(relativistic_breit_wigner, bin_centers, bin_contents, p0=[90, 10, 1000], sigma=np.sqrt(bin_contents))

plt.hist(dimuon_p4.mass, bins=40, range=(70, 110), label='Data')
x = np.linspace(80, 100, 200)
y = relativistic_breit_wigner(x, *popt)
plt.plot(x, y, label='Fit')
plt.xlabel('Dimuon invariant mass [GeV]')
plt.ylabel('Number of dimuon events / 1 MeV')
plt.legend()
plt.show()
.to_numpy()You may have noticed the
.to_numpy()used on the massArrayabove. As of Awkward Array 1.4.0, this is necessary fornp.histogram()to work, but this should be fixed in the next version.
The peak position is stored in popt[0]:
popt[0]
90.77360288470875
Pretty close to the real mass, 91.1876 GeV.
Key Points
There are many packages for fitting, and this just one very simple example.