Step 3: Make the plots
Overview
Teaching: 5 min
Exercises: 10 minQuestions
How do we combine the histograms?
Objectives
Make plots of all observables
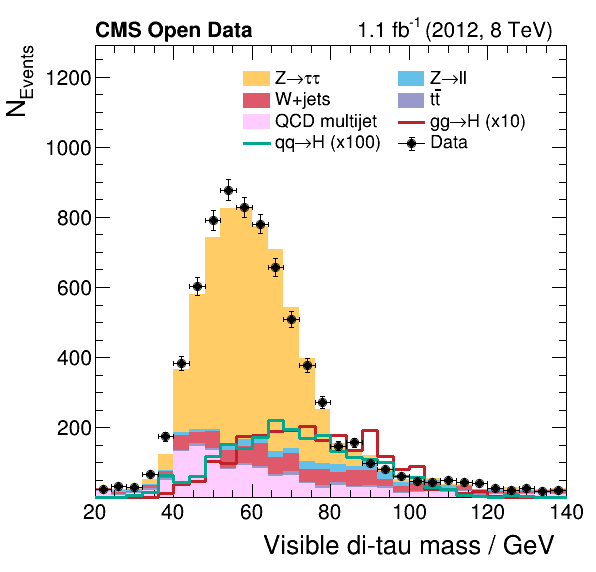
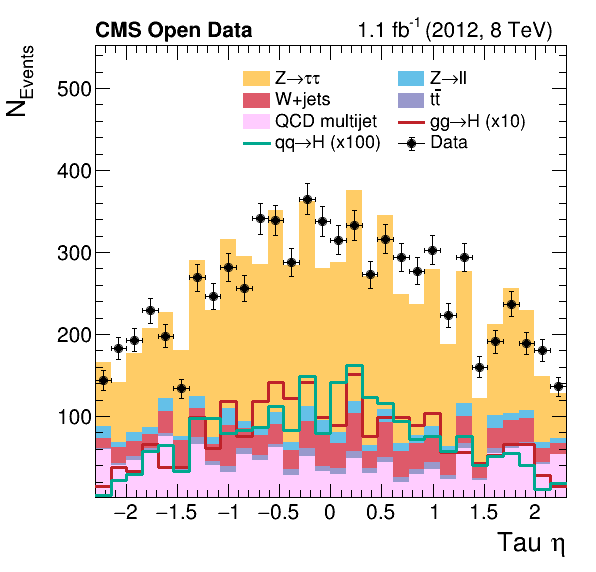
Finally, the histograms are combined to produce the final plots showing the data taken with the CMS detector compared with the expectation from the background estimates. These plots allow one to study the contribution of the different physics processes to the data taken with the CMS detector and represent the first step towards verifying the existence of the Higgs boson.
To combine the histograms produced in the previous step into meaningful plots, run the following command.
mkdir -p $HOME/awesome-workshop/plots
bash plot.sh $HOME/awesome-workshop/histograms/histograms.root $HOME/awesome-workshop/plots
The Python script generates for each variable a png and pdf image file, which can be viewed with a program of your choice. Two example outputs are shown below. Note that this analysis runs only over a fraction of the available data.
Key Points
The plotting combines all histograms to produce estimates of the physical processes and create a figure with a physical meaning.
The plots show the share of the contributing physical processes to the data.
We do not include any systematic uncertainties in this example.