Introduction
Overview
Teaching: 10 min
Exercises: 0 minQuestions
What is the purpose if this analysis?
Objectives
Understand why we prepared this example analysis
Understand what the analysis is doing
Why have we prepared this analysis?
We have prepared this example analysis as common baseline for learning the technologies discussed in this workshop. The goal is to have a working example that is simple yet complex enough to demonstrate common problems and their solutions in physics analysis.
The analysis is taken from the CERN Open Data portal and modified to fit our needs. You can find there additional information complementing the explanation below.
The analysis
This analysis uses data and simulated events at the CMS experiment from 2012 with the goal of studying decays of a Higgs boson into two tau leptons. The final state is a muon lepton and a hadronically decaying tau lepton. The analysis loosely follows the setup of the official CMS analysis published in 2014.
The purpose of the original CMS analysis was to establish the existence of the Higgs boson decaying into two tau leptons. Since performing this analysis properly with full consideration of all systematic uncertainties is an enormously complex task, we reduce this analysis to the qualitative study of the kinematics and properties of such events without a statistical analysis. However, as you can explore in this record, already such a reduced analysis is complex and requires extensive physics knowledge, which makes this a perfect first look into the procedures required to claim the evidence or existence of a new particle.
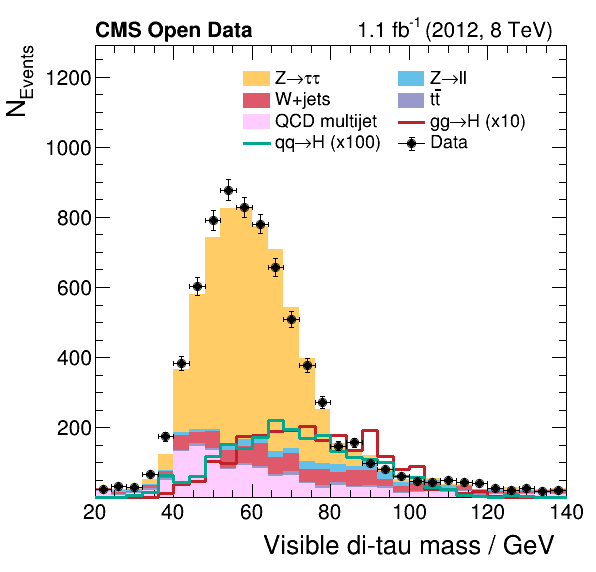
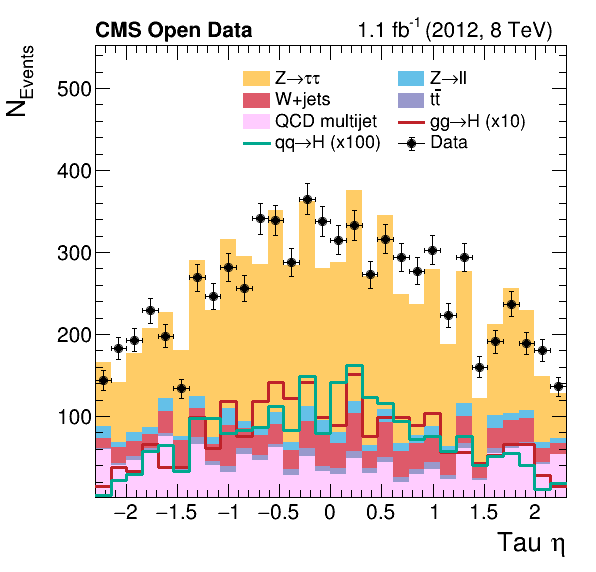
Two example results produced by this analysis can be seen below. The plots show the data recorded by the detector compared with the estimation of the contributing processes, which are explained below. The analysis has implemented the visualization of 34 such observables.
Analysis steps
The analysis steps follow the typical workflow of such an analysis at CMS. An overview of these steps is given in the following and the full details can be found in the analysis code and the description of the single sections of the lesson. The detailed technical description how to run the analysis is included separately in the respective section of the lesson.
- First, the NanoAOD files containing data and simulated events are pre-processed. This step is called ‘skimming’ since the event selection reduces the size of the datasets significantly. In addition, we perform a pair selection to find from the muon and tau collections the pair which is most likely to have originated from the Higgs boson.
- The first step produces skimmed datasets from the original files but still preserves information of selected quantities for each event. In this second step, we compute histograms of these quantities for all the skimmed datasets. Because of the data-driven QCD estimation (explained later in the physics background), similar histograms have to be produced with the selection containing same-charged tau lepton pairs. This sums up to multiple hundreds of histograms which have to be combined to produce the final plots such as the ones shown above.
- Finally, the histograms are combined to produce the final plots showing the data taken with the CMS detector compared with the expectation from the background estimations. These plots make it possible to study the contribution of the different physics processes to the data taken with the CMS detector, and represent the first step towards verifying the existence of the Higgs boson.
- To perform a measurement, we have to fit the expected contributions of physics processes to the data from the experiment. The procedure followed for this step is similar to what was done originally to measure the signal strength and claim the existence of the Higgs boson.
Disclaimer: How to interpret the results
Please note that a proper analysis of data always requires a thorough study of all uncertainties. Since this analysis does not include any systematic uncertainties, the resulting plots should be interpreted only qualitatively. For a valid physics measurement, the differences between the data and the sum of all processes would have to be explained within the uncertainties. Also note that the counts for the simulated Higgs boson events are scaled up to make the expected signal contribution visible by eye.
Reminder: Have you set up your environment?
Please go here, select one of the options to set up your environment with the required software and download the required files.
Key Points
Example analysis used as common baseline for learning the technologies discussed at the workshop
This analysis studies decays of a Higgs boson into two tau leptons in the final state of a muon lepton and a hadronically decayed tau lepton